Skills
Research, Data analytics, ML
Professional Project: Product Manager
Customer Activity Predictor
A tool that helps subscription companies predict their customer activity with ~90% accuracy for the upcoming month. Customers are put into three main buckets: 1) Likely to Cancel, 2) Power user, and 3) Oppertunity user. This predictor aims to help companies more intelligently reach out to their users based on each user's status.
Vision
Help subscription companies improve customer retention rate, increase revenue, and level up their product value by catering more closely to customer needs. Having a deeper understanding of your customers on an individual basis allows companies to:
1) target unhappy customers ahead of time and alleviate concerns
2) build stronger relationships with their Power users and leverage them as beta testers for upcoming new features.
For smaller subscription-based startups, data collection and analysis are often deprioritized to building new and interesting features. This can lead to a pitfall of not understanding their user base and failing to meet customer needs. The goal of this tool was to give deeper customer insights so that companies can focus on building and selling quality products.
Process Overview

Software
The first step was to determine what different metrics we were tracking that could be utilized to predict a customer's future behavior. Initially, as a subscription company ourselves, I chose to hone in on our own customer base and see if this prediction model was even feasible. I analyzed our historical customer data and found a few metrics that appeared to have a strong correlation with the longevity of a customer.
From there, I shared my findings with the engineering team and we worked together to build an ML model to run this prediction on a set of beta companies who agreed to be part of the study. After testing several models, we determined to continue on the XG Boost ML model.
We chose this model over others for a few reasons, including:
1) Works well with large data and complex data sets. This model is also easily scalable.
This was a critical consideration because the underlying base assumption we have is that ideally companies on our platform will continue to grow, and their customer data will continue to evolve.
2) Ability to work well with missing data
Often when working with companies on our platform, I would find manual errors that were made when entering their user data. This could sometimes lead to incorrect or missing data. We needed a model that would be able to handle customer errors well.
3) Supervised learning model
Since we work with external businesses, it's critical to have some control and understanding over the output of the data. Businesses are often reluctant to trust financial information tools that they have no understanding of. Using a supervised learning model helps our end user feel a bit more certain about the output data because there are fewer uncertainties. In this type of situation, understanding was a bit more key than accuracy.
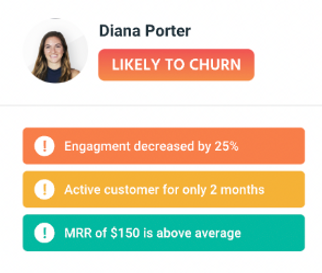
We found that the three metrics with the strongest correlation to customer future activity were: engagement level, monthly recurring revenue, and age of account.
MVP: Research + Design
For the minimum viable product (MVP), I prioritized accuracy and user fit.
In the first iteration, I shared a simple CSV file with generated customer predictions with our beta users. At the start of each month, I would share an updated CSV with the previous month's predictions followed by the current predictions. Any user that had canceled would appear on the sheet, but would not have an updated status after the point of cancellation. I would regularly sync up with my beta users to get feedback from them on:
1. any concerns they had regarding the data generated
2. understand how they were using this data
3. any additional pieces of information they wanted access to
Through this iterative research process, I was able to uncover different edge cases that were not originally taken into account. One example of an edge case was complicated user history (pausing and unpausing a subscription). With this feedback, the engineering team and I were able to build a more nuanced prediction model that eventually reached about 90% accuracy.
Beyond developing realistic predictions, I needed to measure the level of value this product added for businesses. In product development, we want to ensure that the product meets both the end-user's needs and the business's needs. To ensure that this product was marketable, I worked closely with the design team to create a mockup design of what the UI would look like and shared it with 100 companies on our platform. Approximately 70% of users we had reached out to signaled a desire to utilize this product.
The image at the right shows what each business would see when they clicked on each of their customer's profiles. I wanted to ensure that the new information I was including could be easily integrated into the existing interface and did not require additional learning from the business. On the left, I chose to add a panel showed engagement, MRR, and likelihood to churn score to give the end user visibility into their customer's specific behaviors. Within the Overall activity, I included their customer prediction so they could easily see how it shifted month over month.


